All life on Earth is based on carbon.
Carbon has two stable isotopes.
12C, which makes up 98.93% of carbon and
13C, which makes up 1.07%.
Note: 12C is pronounced "C twelve"
Sea water contains more
13C than fresh water. The higher
13C ratio passes through the marine food chain so that fish have more
13C than say pigs or chickens. Humans who eat a lot of fish end up with more
13C in their bones than those who don't.
When this was discovered, archaeologists went back to hundreds of bone samples and tested for
13C levels.
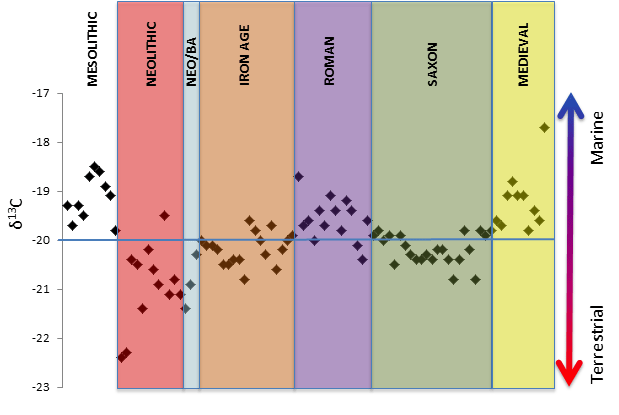 Fig. 5.1
 Carbon 13 levels across history
Fig. 5.1 shows how carbon 13 levels have varies over time. The y axis shows the ratio of
13C to
12C. A high ratio indicates a high level of fish consumption.
NOTE: The δ13C notation on the y axis is used for this type of data. The quantities of C-13 are very small. It is easier for scientists to compare them to an internationally agreed standard ratio of C-13 to C-12. So if δ13C = -21 it is 21 parts per thousand less than the international standard. Most δ13C values are negative. This looks odd, but all it means is that most C-13 levels are below the standard.
This data shows that the consumption of fish went up and down through history. It looks like the Romans liked their fish, but the Saxons did not. Was it because agricultural communities did not need fish and were happy to stay at home and use farmed animals for protein? Was it a taboo about eating fish? All these questions need to be considered by looking at other historical evidence, but without isotope analysis it is true that these questions might never have been asked.
How do you measure isotope ratios when the difference between two isotopes is ONE NEUTRON?
The answer is
Isotope Ratio Mass Spectrometry.
Collagen from bone is burnt in a furnace to produce CO
2. The CO
2 is ionised to give it a charge, then accelerated in a vacuum through a magnetic field. The magnetic field bends the path of the CO
2.
13C is one neutron heavier than
12C so it curves a tiny bit less.
The device is measuring the mass/charge ratio. The more mass the less it will bend. The more charge, the more it will bend.
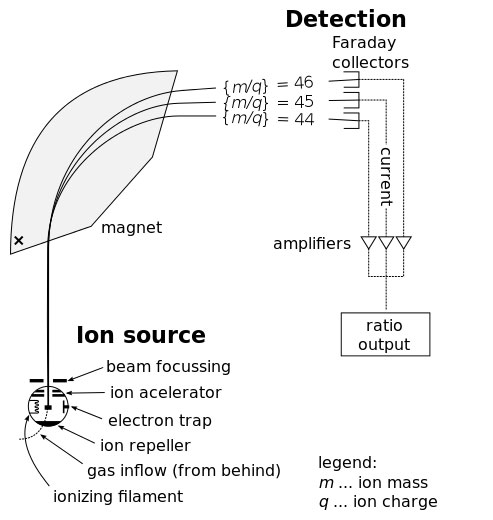
Fig. 5.2 Isotope Ratio Mass Spectrometer
http://en.wikipedia.org/wiki/Isotope-ratio_mass_spectrometry
Questions
1. If you were trying to verify the isotope ratio data in Fig. 5.1, what questions might you ask?
2. What might cause a drop in fish eating during neolithic and Saxon times?
3. Why do you think bone collagen survives intact for so long?
4. What is the mass of a CO2 molecule where the carbon atom is 12C?
5 .What is the mass of a CO2 molecule where the carbon atom is 13C?
6. Measuring the mass/charge ratio of CO2 will show up the difference of one neutron mass between the two isotopes of carbon. What is the ratio of masses?
7. Can you think of something that might mess up the results? (Keep thinking about isotopes)
CLICK FOR ANSWERS
<previous page next page>
<back to start