We have seen how
13C /
12C isotope ratios (called
δ13C) tell us about how much marine food was in human diets.
Nitrogen also has a main isotope
14N (99.636%) and a small amount of a stable isotope
15N (0.364 %)
The level of the
15N isotope in bone collagen is linked to the accumulation
of
15N from eating protein. Protein contains amino acids, which are the source
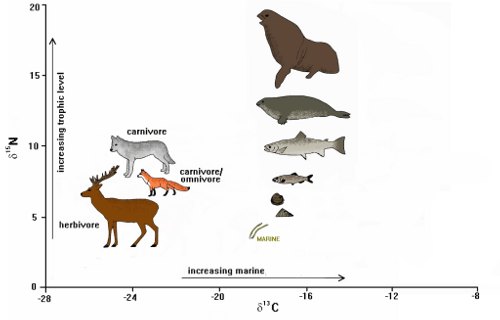
of the nitrogen. As you go up in the food chain the nitrogen in amino acids is passed upwards, leading to high
15N levels accumulating in your own protein, including collagen in your bones. The level up the food chain is called the trophic level.
Only a few milligrams of collagen are need to do this test. The instrument used is an Isotope Ratio Mass Spectrometer. It can resolve the mass of a compound with an accuracy of 0.5 parts per million!
Plotting
δ
13C and
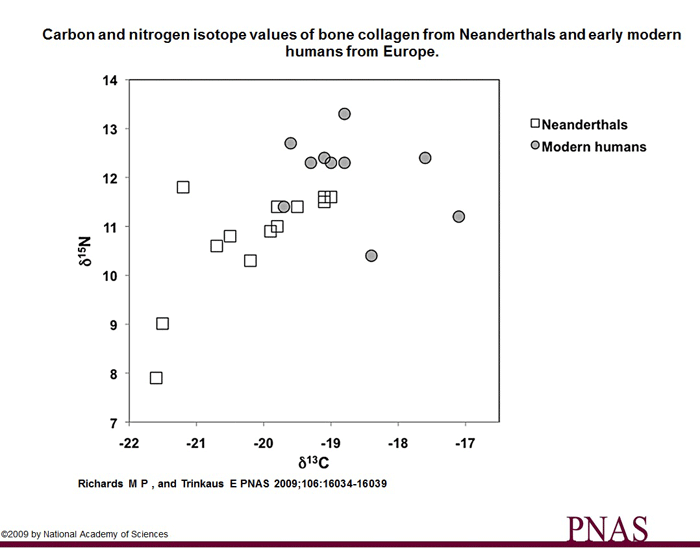
δ15N on a scatter diagram gives us information about how high up the trophic level and how marine it is.
NOTE: The 15N/14N ratio is called δ15N "delta 15 N"
The delta notation is exactly the same as for δ13C. It means the difference between the ratio 15N/14N in the sample and an internationally agreed reference. The δ15N values in the chart below are positive. That means they are above the international standard, while the δ13C values are negative, which means they are below the international standard.
 Fig.6.1 15
N levels show how high up the food chain you are (the trophic level)
Collagen in bone is often well preserved even from as far back as Neanderthal times (up to 250,000 years).
 Fig 6.2
 Neanderthal vs modern human
δ
13C vs
δ15N.
Fig. 6.2 shows that we eat a higher proportion of animal protein with high trophic levels and also a higher proportion of marine protein than Neanderthals.
This diagram comes from an American scientific paper. It is aimed at university level scientists, but it is useful to see what a science paper looks like. Check out how many references are used!
http://www.pnas.org/content/106/38/16034.full
Questions
1. What can Fig. 5.4 tell you about Neanderthal life?
2. Are these groups of Neanderthals and modern humans completely distinct?
CLICK FOR ANSWERS
<previous page next page>
<back to start